Before diving into your project, it’s essential to understand the Integrative Process LEED credit category and its significance in achieving LEED certification. The Integrative Process credit category encourages a collaborative and holistic approach to sustainable design and construction. Here’s what you should know before starting your project:
- The goal of the credit: The Integrative Process credit category aims to foster a collaborative environment where project teams, including architects, engineers, contractors, and other stakeholders, work together from the early stages to identify and implement sustainable strategies. The category emphasizes a systems-thinking approach to optimize building performance and reduce environmental impact.
- Early engagement is key: To maximize the potential of the Integrative Process credit category , it’s crucial to engage the project team as early as possible. The category encourages involving key stakeholders from various disciplines from the beginning of the project. This allows for the integration of diverse perspectives, expertise, and ideas to identify sustainable strategies that align with project goals.
- Establish project goals and performance targets: The Integrative Process credit category requires defining clear project goals and performance targets early on. This helps shape the decision-making process and ensures that sustainable strategies are aligned with the project’s objectives. Establishing performance targets allows the team to prioritize and focus on areas where significant improvements can be achieved.
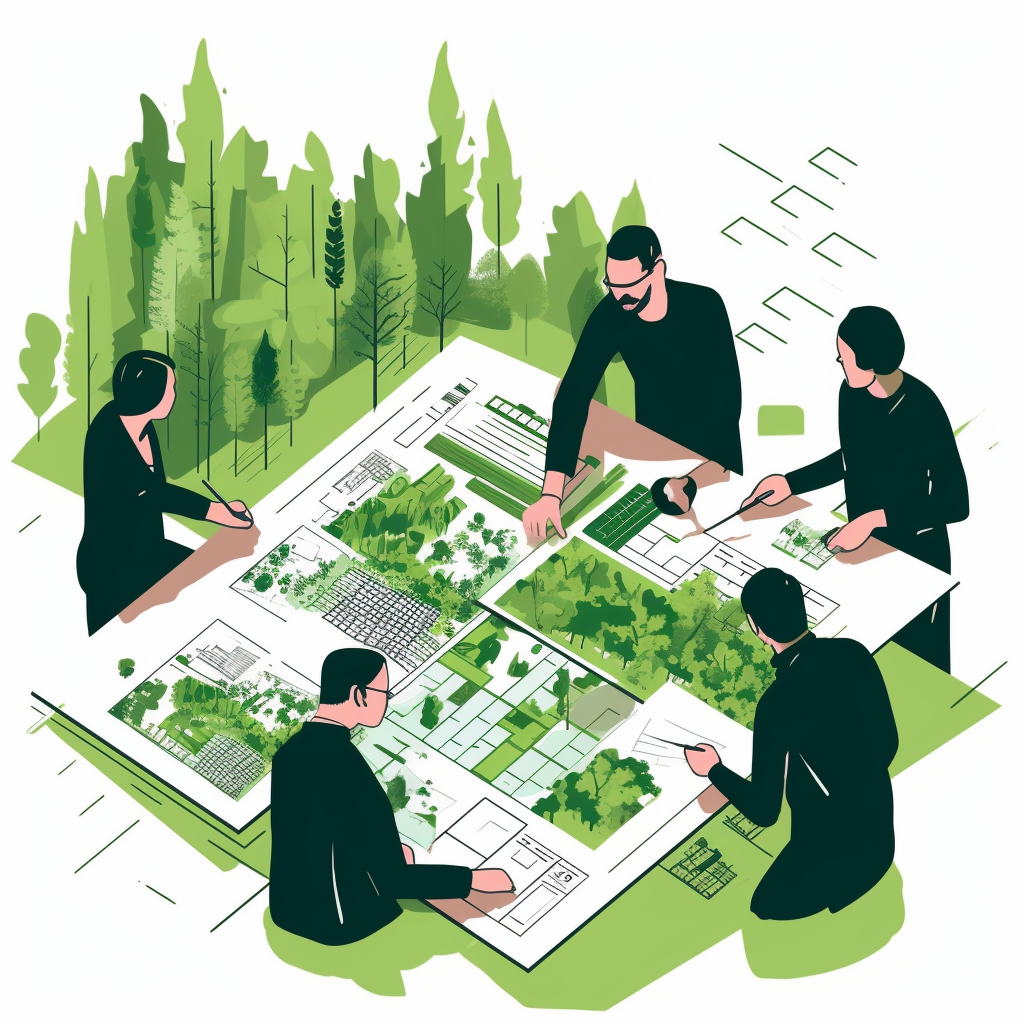
- Foster a collaborative environment: The category emphasizes the importance of fostering collaboration and communication among project team members. Regular meetings and workshops can facilitate knowledge sharing and brainstorming sessions. Encourage open dialogue, active participation, and the exchange of ideas to maximize the effectiveness of the integrative process.
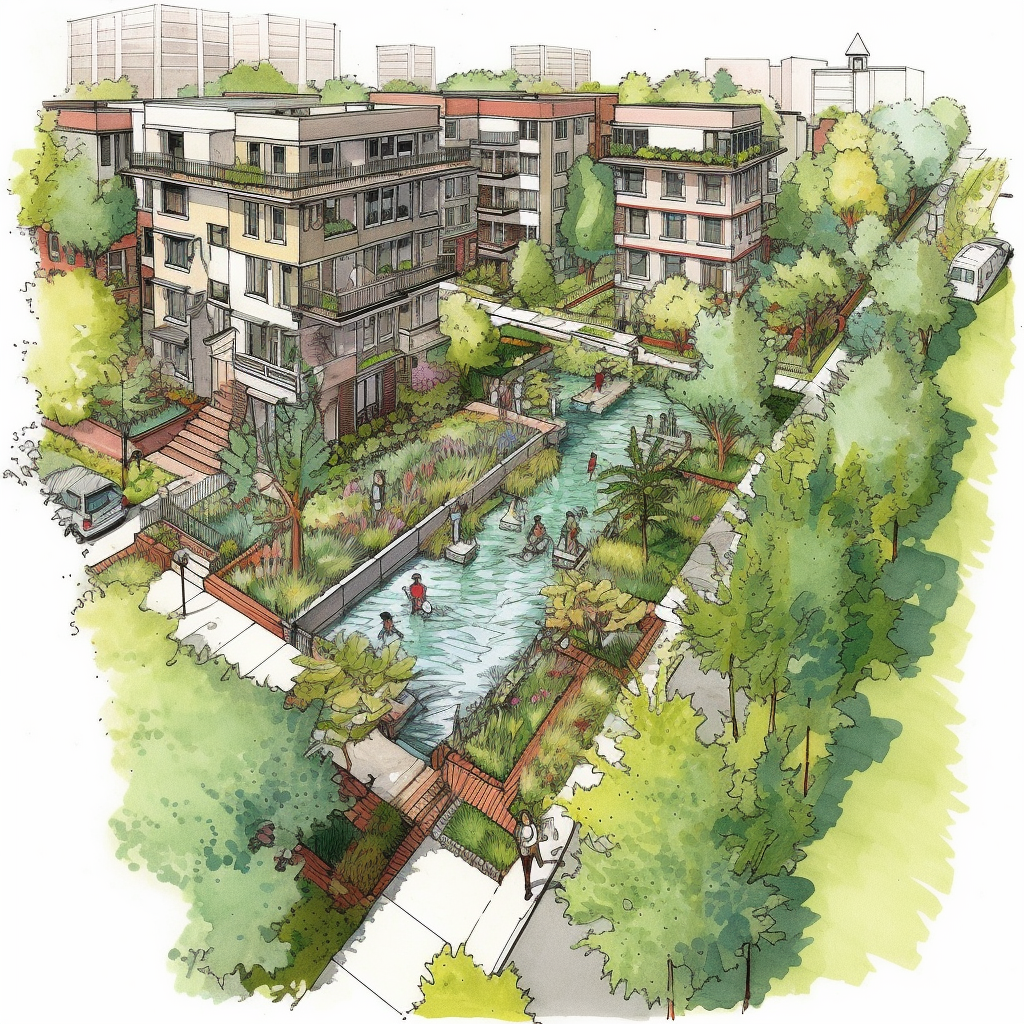
- Embrace a systems-thinking approach: The Integrative Process category encourages the consideration of the building as a whole system. Rather than addressing components or systems in isolation, a systems-thinking approach takes into account the interdependencies and interactions among various building elements. This approach can lead to synergistic solutions that optimize performance and reduce resource consumption.
- Documentation and reporting: Like other LEED credit categories, proper documentation is essential for maximizing points. Track and record the collaborative activities, decision-making processes, and implementation of sustainable strategies throughout the project. Documenting the integrative efforts helps demonstrate compliance and facilitates the certification process.
The Integrative Process credit category offers an opportunity to enhance the sustainability outcomes of your project. By embracing collaboration, early engagement, and a systems-thinking approach, you can unlock synergies among project team members and optimize the environmental performance of your building.
Remember, consulting with sustainability professionals, such as Watearth, can provide valuable guidance and expertise to ensure the successful implementation of the Integrative Process category and other sustainable strategies throughout your project.
 As a sustainable engineering and environmental consulting firm, Watearth has been helping clients achieve their sustainability goals for years, including on LEED projects.