This blog was written by guest contributor Jeremy Liby, Watearth’s Geologist/GIS Specialist. Liby is a talented Geologist and GIS Specialist with more than a decade of experience in data collection and analysis, GIS, and producing technical graphics using a variety of tools such as ArcGIS and CAD. In the field, Liby’s experience includes conducting PH I and II Environmental Site Assessments (ESAs), soil sampling, wetland delineations, drilling groundwater wells, groundwater sampling, well development, and field crew/subcontractor project management. Liby supports Watearth projects by interpreting complex field data and translating it into clear and descriptive reports and exhibits that follow Watearth’s documentation process and core values of producing quality deliverables with reliable service to our clients. Utilizing hands-on field experiences combined with an extensive background in spatial analysis and data collection makes Liby a key team member and support resource for Watearth projects.
What is GIS?
A Geographic Information System (GIS) is a powerful and essential tool used in numerous industries, from engineering to urban planning to insurance, and is particularly apt for use with water resources planning, modeling, and design. The purpose of GIS is “to capture, store, manipulate, analyze, manage, and present all types of geographical data.” In other words, GIS is designed to manage spatial data related to locations on earth.
GIS and Water Resources
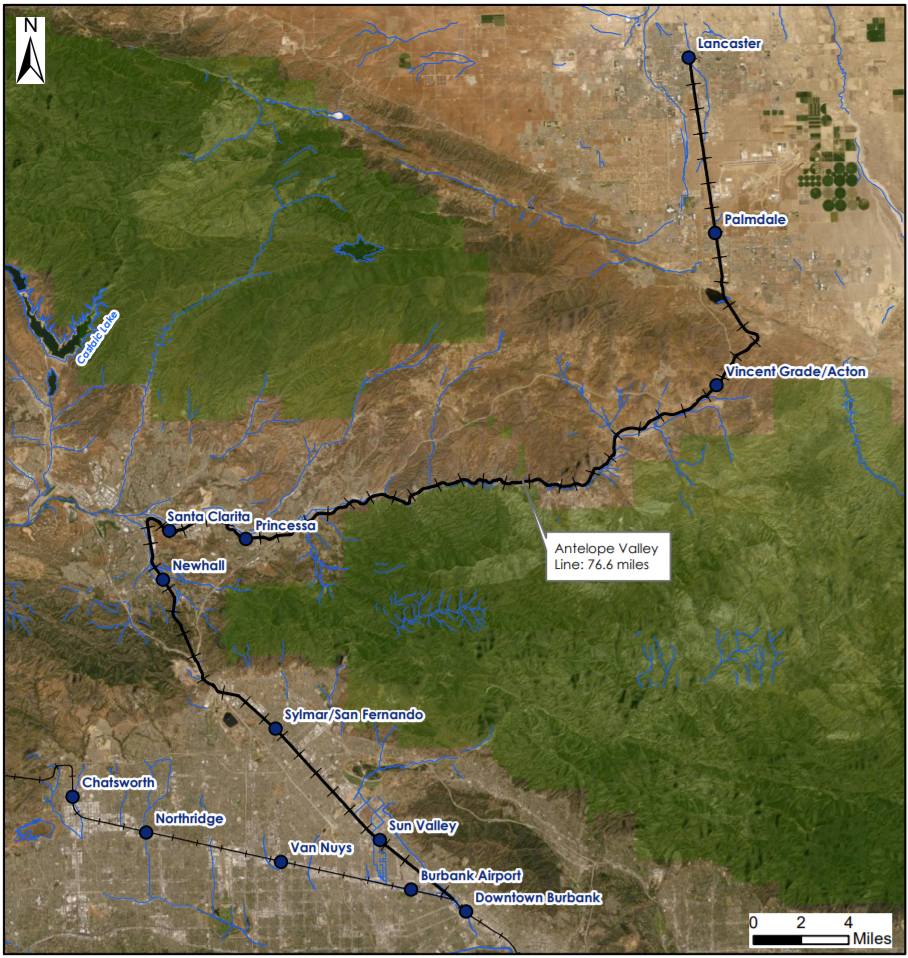
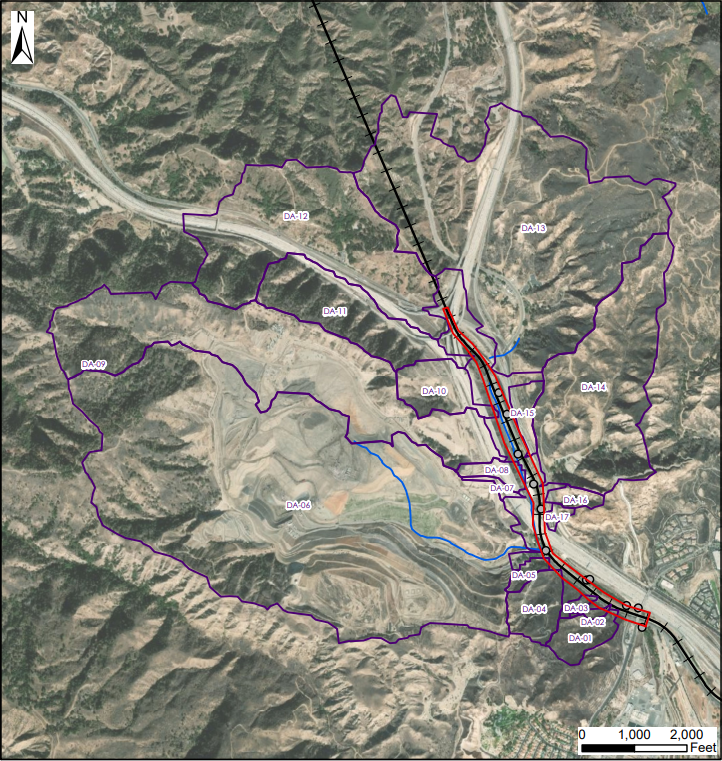
Many technical water resources projects benefit from GIS, including environmental, stormwater management, floodplain management, and other significant engineering projects. GIS can be used to complete complex analyses such as calculating hydrologic parameters, drainage area delineation, floodplain mapping, stormwater drainage capacities, determining ideal green infrastructure types based on land use, and many more. In addition to analysis, GIS can also visualize every project component.
GIS and the Environment
An example of an environmental application of GIS is a groundwater monitoring project. GPS coordinates of groundwater monitoring wells at a project site are collected in the field and converted to points added to GIS. GIS then ties data to each of these points. Data examples linked to GIS points include groundwater well depth, groundwater elevation, groundwater contamination type, groundwater contamination levels, and coordinates. Finally, the groundwater flow is visualized using the applied groundwater elevation data by generating water table elevation contours. Additionally, visualization of a contamination plume is created by generating contamination level contours. Combining groundwater elevation and flow direction with contamination plume locations determines the potential future migration of groundwater contamination. Visualization of a contamination plum can aid in determining mitigation measures and the urgency with which these measures need to be treated.
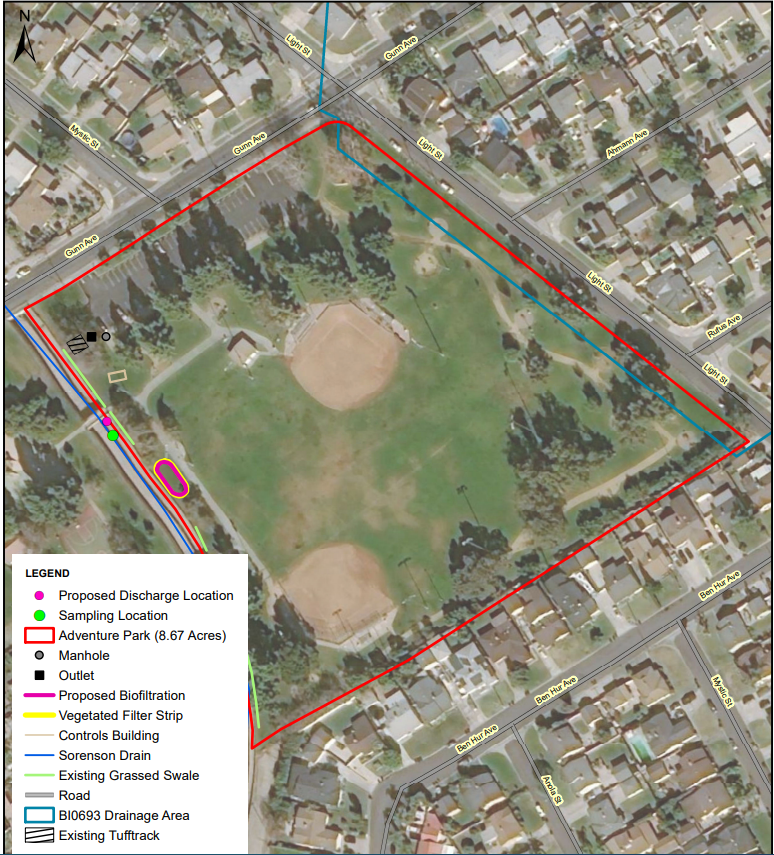
GIS and Stormwater
Another example of beneficial GIS application is determining the deficiencies of a storm drain network. First, field verified and surveyed data of a storm drain network are mapped using GIS. Next, three-dimensional attributes are tied to a storm drainage feature like ground elevation, depth to the storm drain feature (which can be used to calculate the invert elevation), and appropriate sizing of the storm drain feature. These values are used to determine the slope of a storm drainage network and the amount of flow that can move through the storm drain network. With this information and surface topography features, whether engineered or natural, it can be determined how stormwater flows, how much flows into the stormwater drainage network, and which stormwater drainage features are insufficient for various amounts of stormwater. The storm drain network is then visually presented in maps with any deficiencies of the storm drain network.
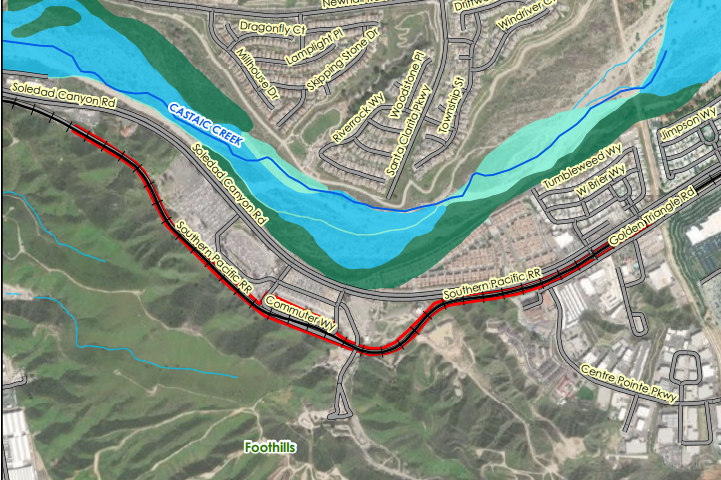
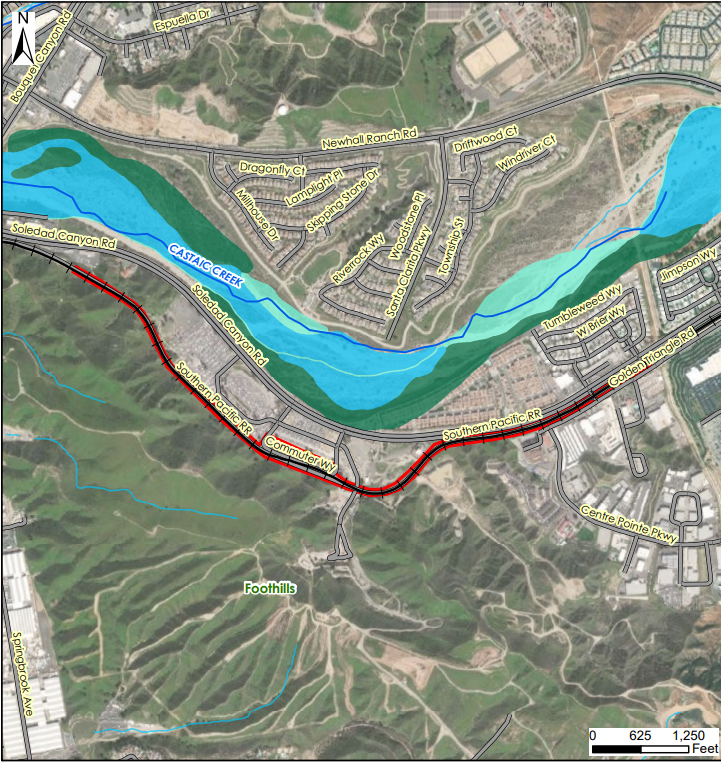
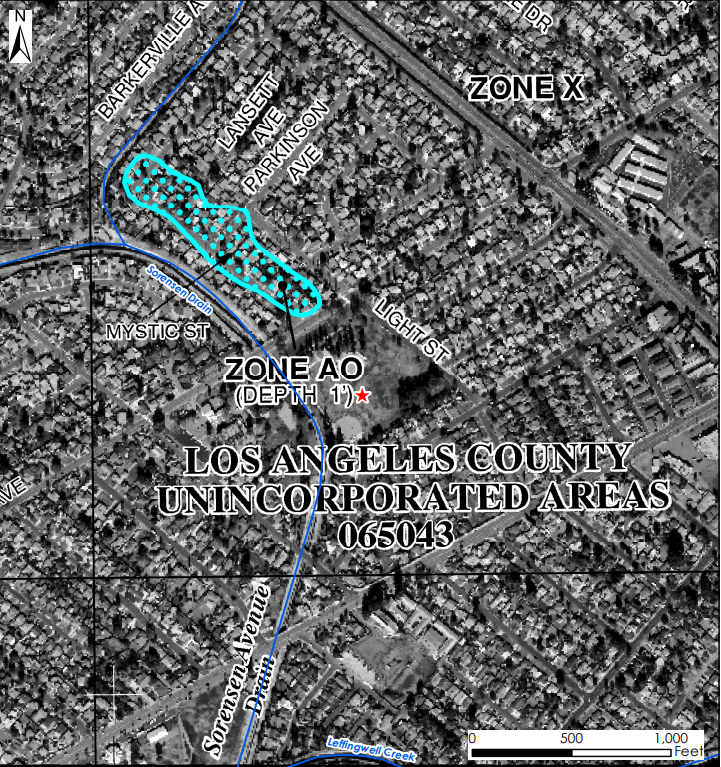
GIS and Floodplain Management
A new construction residential development with nearby streams is an excellent example of a floodplain management application where GIS is useful. Publicly available 100-year and 500-year floodplain boundaries from the Federal Emergency Management Agency (FEMA) may show that the building location of new residential properties is in a high-risk flooding zone. The floodplain boundaries are mapped in GIS to visualize these problem areas quickly. Then it is possible to determine how to reduce flood risk, including ways of diverting streams or other storm drain features that can slow flow through the new development. Mitigation measures can be modeled with various storm events to determine new floodplain boundaries that reduce the risk of flooding. The FEMA floodplain boundaries can be altered in GIS to show how the floodplain boundaries have been reduced due to mitigation measures, reducing the risk of flooding in the new residential development project area.
Presenting Data
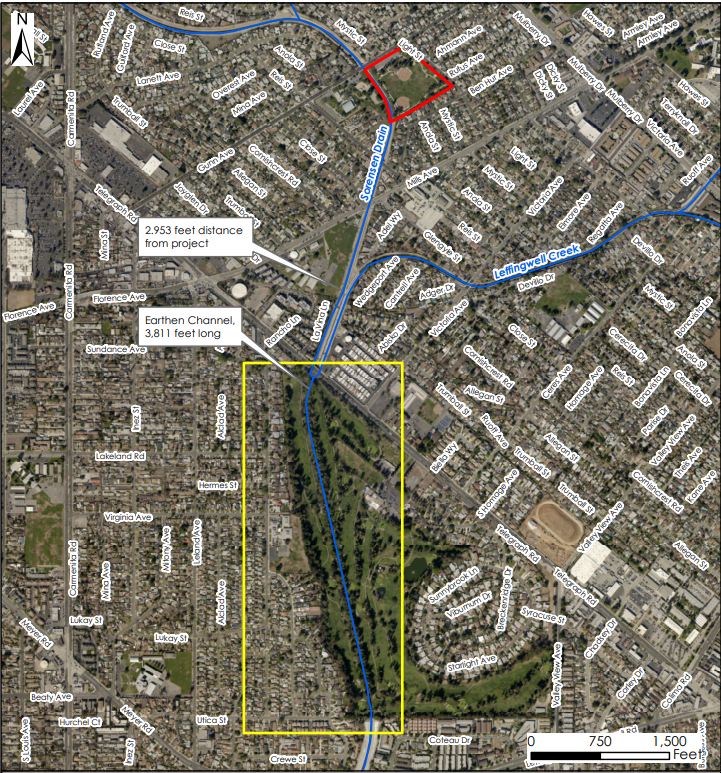
The common theme in all these GIS applications is that GIS collected and generated is presented visually. Visual representation of project results and the project area components are essential to environmental and technical reporting. High-level professional exhibits are generated using GIS. A vast array of publicly available GIS data and manually generated GIS data can be added and manipulated within a GIS exhibit. For example, digital elevation models (DEMs) can visualize elevation changes, field-collected GPS lines and points can visualize significant project area features, and county-provided environmental spatial data can visualize environmental concerns within and around a project area. Many other data types can be collected and displayed in a GIS exhibit. When displaying GIS data in an exhibit, it is critical to highlight the significant features discussed in a project report. The exhibit should only include data relevant to project needs, and multiple exhibits can be created to display each project phase.
When displaying project features, background imagery is essential. For example, aerial imagery displays data where land usage is essential, topography shows where elevation is important, and street maps illustrate where project location is important. Additionally, appropriately symbolized and color-coded project features ensure that significant features are easily located. Finally, labeled elements allow the reader to find the correct information in the exhibit quickly.
Additionally, the appropriate scale is dependent on the map. If only the project area is important, the project area and its features should be 90% of the map. Depending on the shape of the map, the exhibits are generated with the project area in a landscape view or portrait view. If the surrounding features and the project area are both important, the exhibit is zoomed to a scale that shows the appropriate vicinity around the project area. Finally, a professional exhibit must contain a title, a legend, a scale bar, and a north arrow. These components are critical for the reader to establish spatial and directional orientation and quickly read the information.
Why I Love GIS
GIS is my passion. My background is originally in Geology, and my first job out of college was at a large engineering firm as an environmental geologist. I have consistently worked in the field conducting geological field surveys, environmental site assessments, groundwater sampling, and soil sampling. The GIS team frequently reached out to me to discuss data that I had collected in the field so it could be presented effectively in professionally generated exhibits. This grabbed my interest, and as someone who collected the data and saw the project sites in the field, I felt that it would be valuable to add GIS to my skillset. During the field offseason, I asked to be involved in GIS tasks as much as possible, and my passion for GIS took off from there. I went back to school for my GIS certificate and switched to be a full-time GIS analyst. Now that I am at Watearth, I am able to use my past environmental geology and GIS experiences. I am involved in a diverse set of environmental, stormwater management, floodplain management, and green infrastructure development projects. I am very interested in how field-collected data, researched data, and data manipulation all go hand in hand, and how this data provides the basis for every project and any solutions that may come out of it.