Another La Niña year: what does this mean for California?

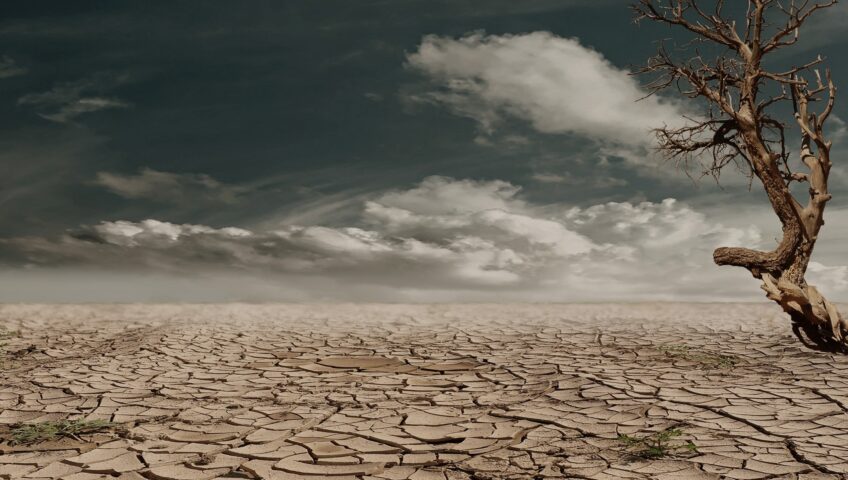
In June of this year, California’s snowpack across the entire state was 0%—meaning snow was entirely melted at the various electronic survey stations across the state used to monitor snow and water levels. As California continues into what appears to be another record drought, climate scientists and Californians alike are hoping the Golden State will experience heavy rain and snowfall in the winter season of 2021-2022. The coming year is a La Niña year, so what does this mean for the drought and the 2022 wildfire season?

What is La Niña?

La Niña is a climate condition in the Pacific Ocean that influences and changes normal wind patterns. During a La Niña event, winters are drier in southern areas of the United States, while the Pacific Northwest and Midwestern states experience more rain and snow than usual. La Niña does not guarantee that California will have a dry winter, but it is highly likely.

What does this mean for California?

In Southern California, La Niña typically has a negative impact on snowpack and water levels. With an 87% chance of La Niña lasting from December to February, Southern California is unlikely to see enough precipitation to bring the current drought to an end. This drought is considered the worst drought on record, surpassing the 2014-2015 drought. Additionally, this is the second consecutive year the Pacific is experiencing La Niña conditions.

Image via Pexels

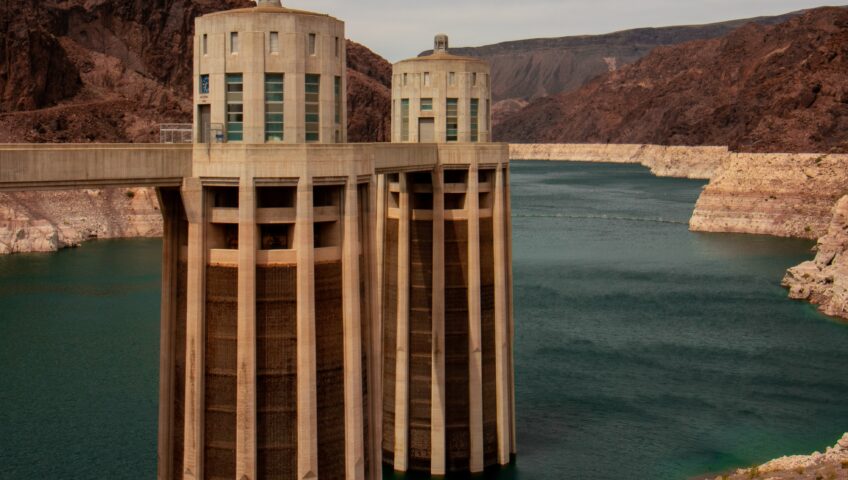
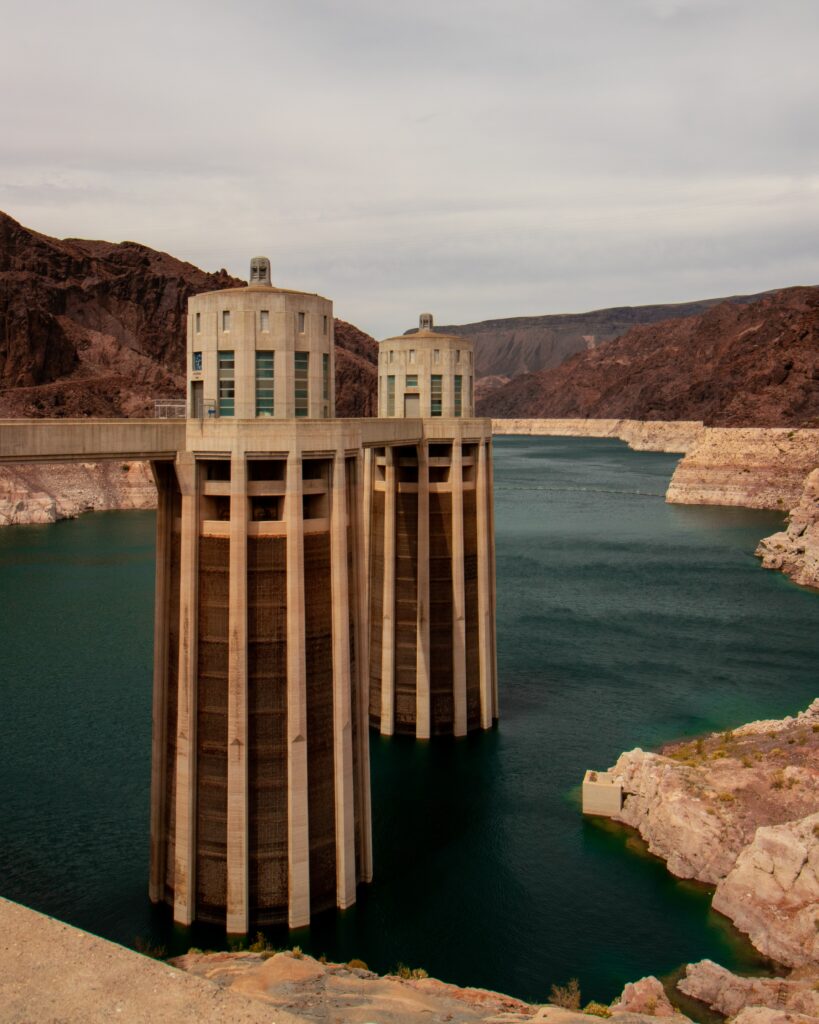
California has experienced more droughts in the 21st Century than have previously been recorded. As mentioned, the four-year drought that occurred between 2012-2016 led to water shortages at hydroelectric power plants, reservoirs, and in the agricultural industry; this drought also killed 102 million forest trees.

La Niña is likely to have a similar effect in Northern California, many climate scientists anticipate air currents will push much of the needed rain into the Pacific Northwest. However, some of the most northern parts of California bordering Oregon may receive significant rainfall.

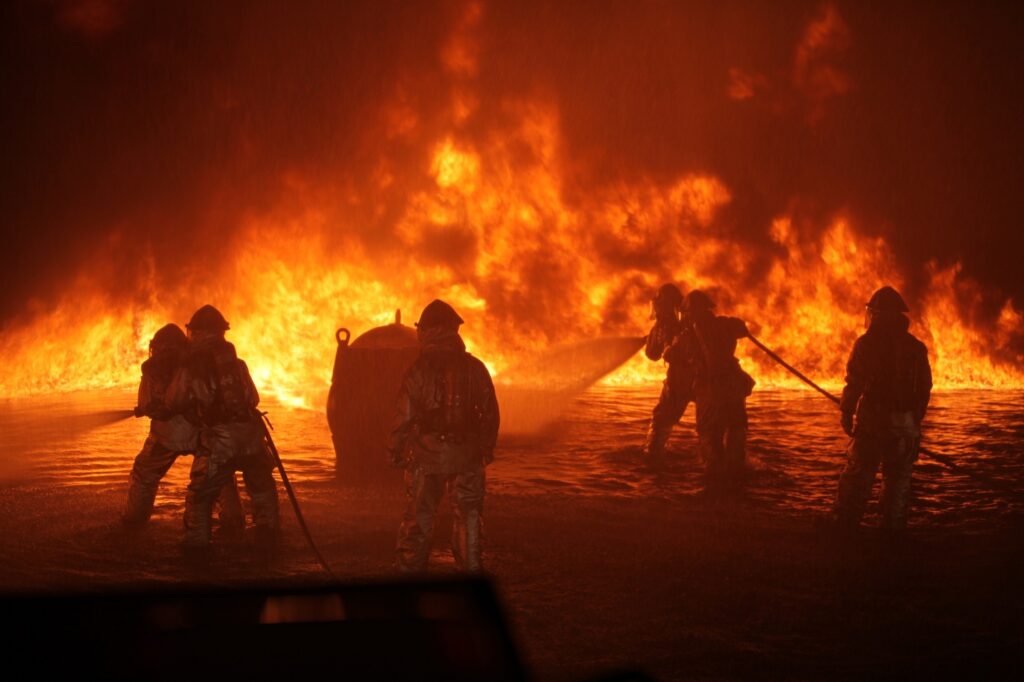
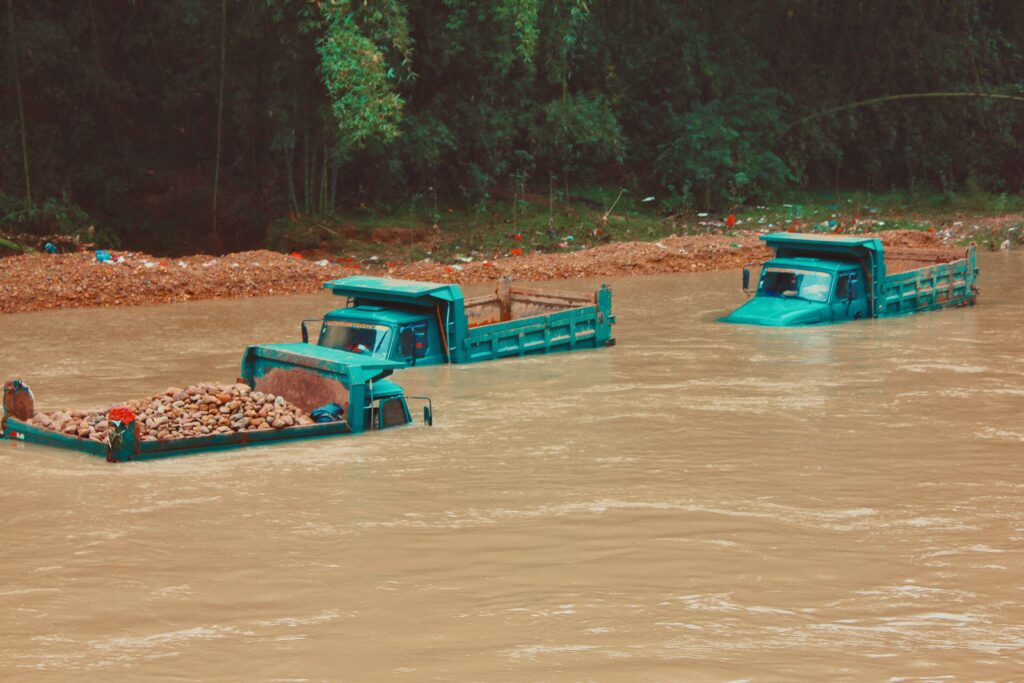
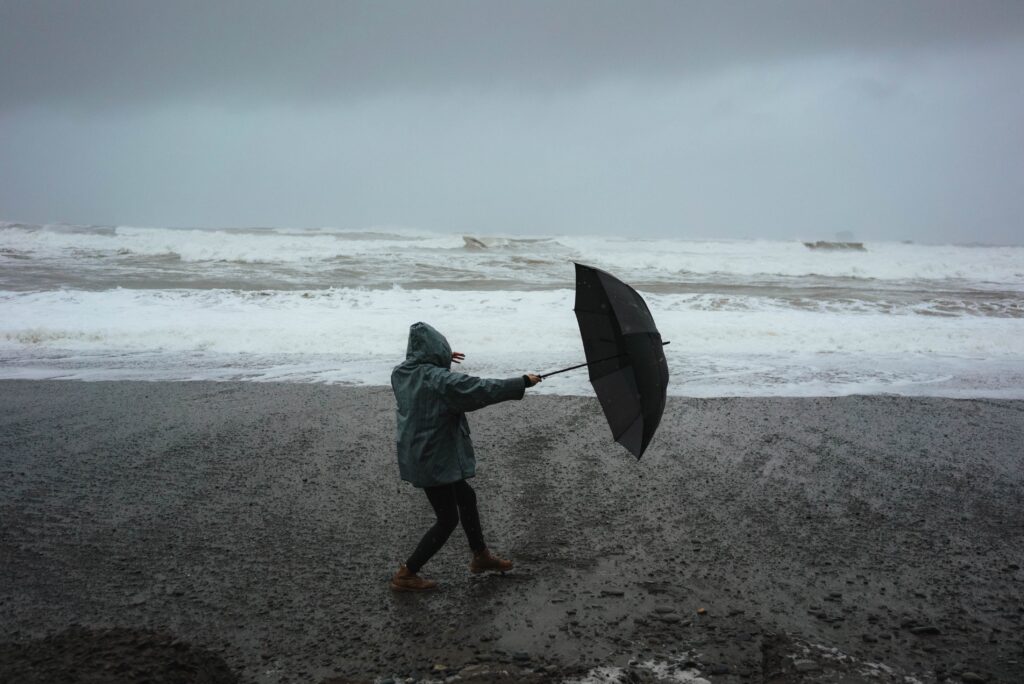
This past year, California experienced some of the largest wildfires in its history aided by the dry conditions. When areas have already been affected by fire and drought, the topsoil is not able to absorb rain because plants have been destroyed, creating a vicious cycle. Rich, earthy soils can absorb and drain water well; however, hard, dry soils cannot drain well making it difficult for plants to reestablish themselves. With La Niña affecting the West Coast for a consecutive year, we are likely to see a similar amount of wildfires and the consequent damages.

Many climate scientists have found there is a direct tie between climate change and continuing issues with droughts. As the climate warms, precipitation is primarily rain rather than snow. Additionally, snow is melting much earlier in the year increasing evaporation. Rising temperatures combined with increasing evaporation reduce available water and can lead to more intense droughts.

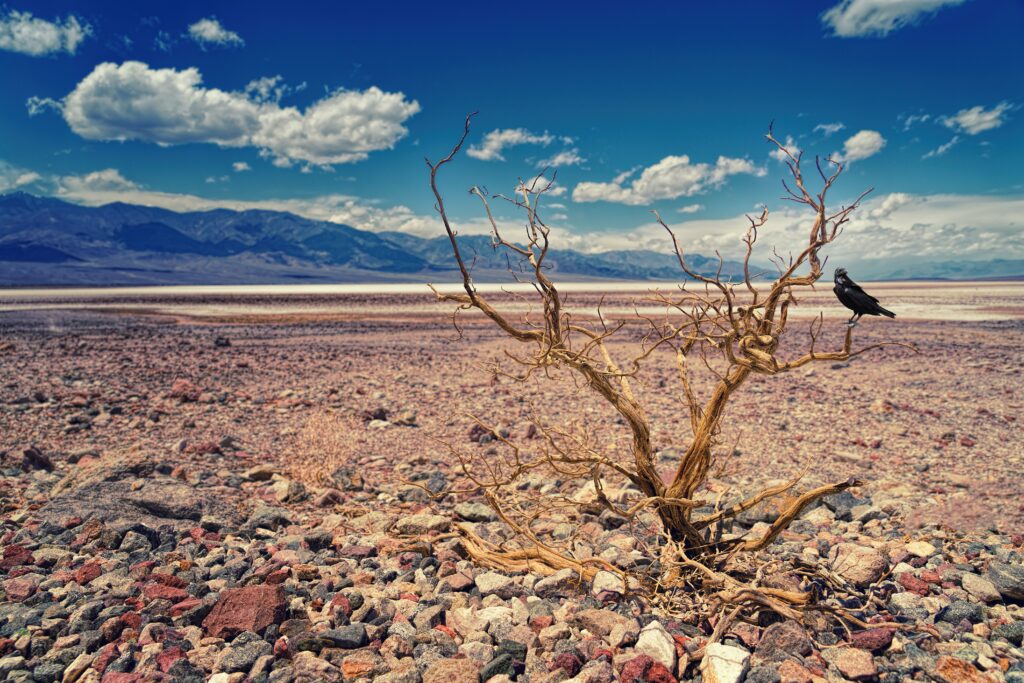
Climate change contributes to continued water shortages, as 93% of the western United States is in a drought condition, with 60% of the region in exceptional drought. The National Weather Service defines an exceptional drought as, “Exceptional and widespread crop/pasture losses; shortages of water in reservoirs, streams, and wells creating water emergencies.” Exceptional drought is the most severe drought classification.

Image via Pexels

Remaining optimistic

While California continues to struggle with extreme weather there have been some positive signs recently.

The Washington Post published a story about heavy precipitation and moisture-rich storms hitting California, as well as Oregon and Washington. In addition to the rain, many feet of snow are possible in the Sierra Nevada as well perhaps ending fire season in Northern and Central California.

While the needed precipitation is a good start to the fall season, the real determining factor will be between December through February, as California will likely experience the brunt of traditional La Niña conditions, or more hopefully, experience a wet winter.
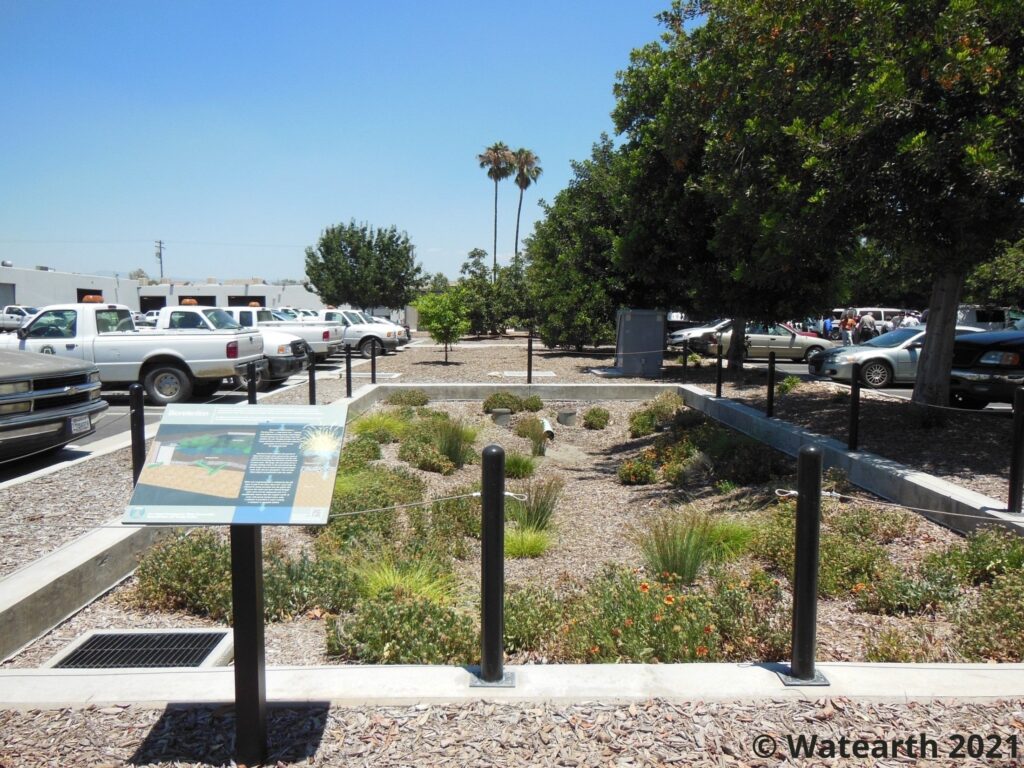
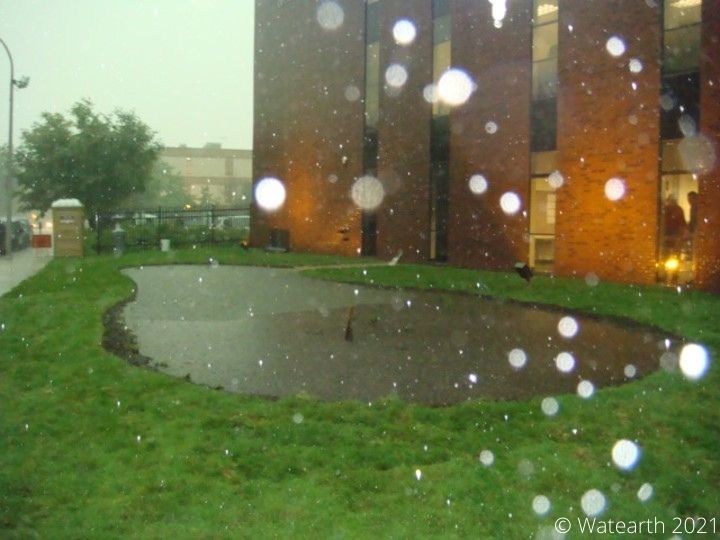
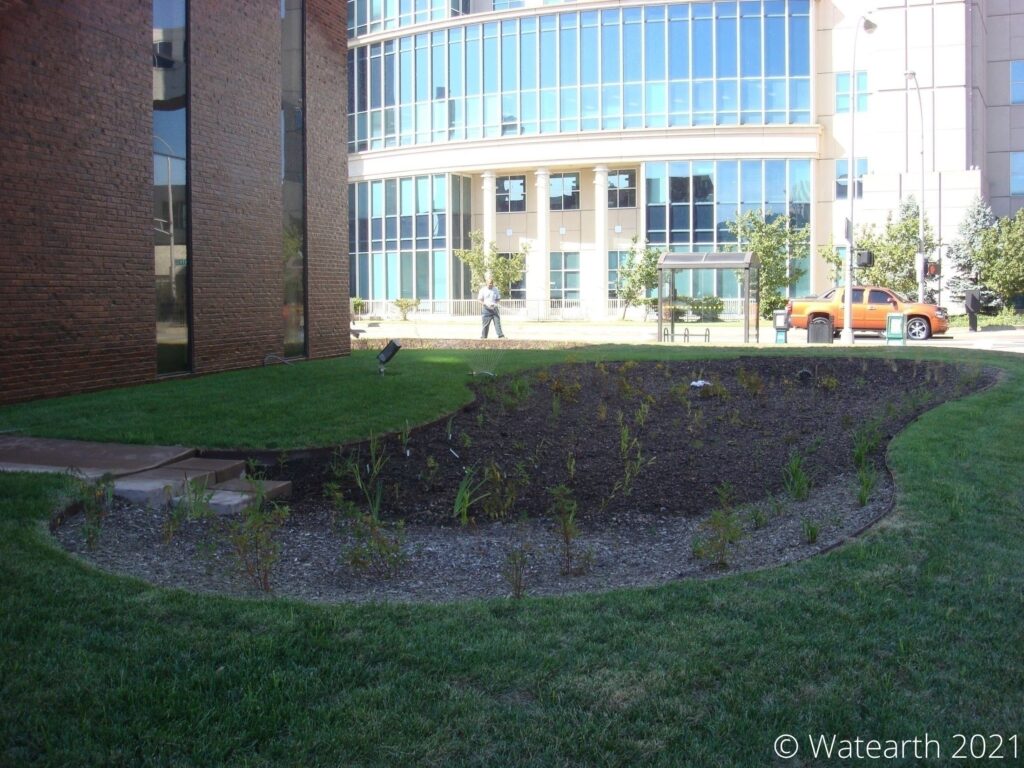
Watearth’s Work

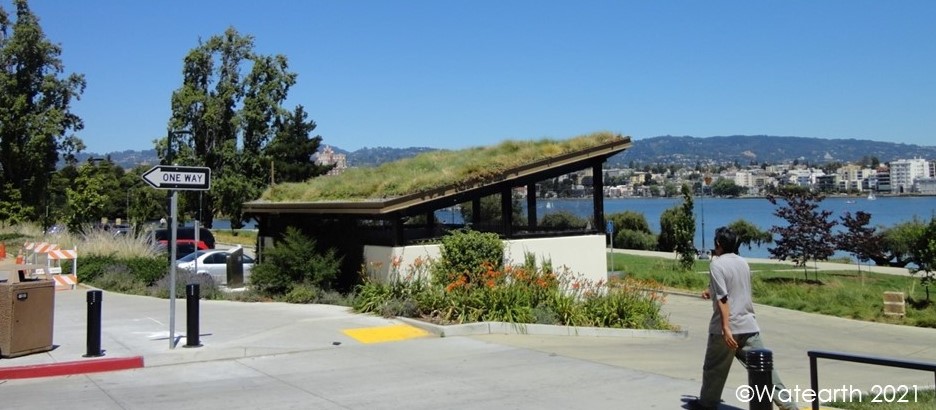
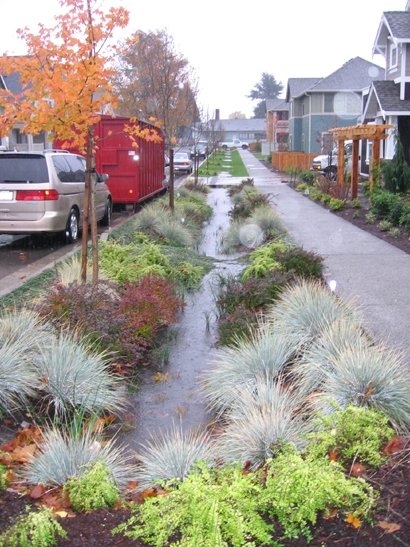
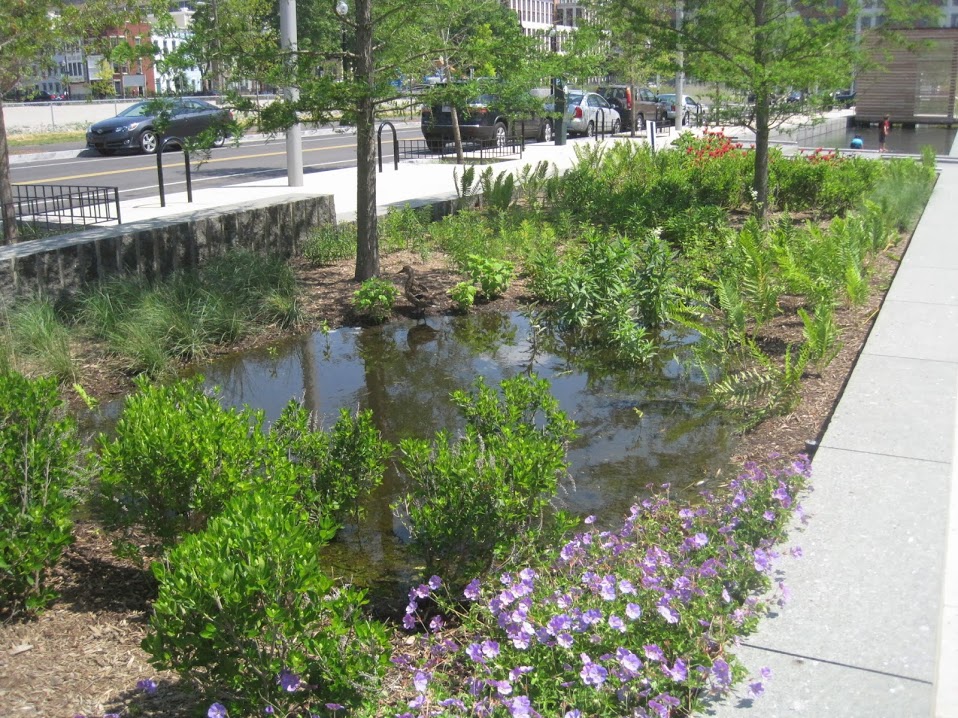
Watearth has significant experience in sustainability, resiliency, and green infrastructure work. In Southern California, Watearth worked with the Orange County Transportation Authority (OCTA) on their Rail Infrastructure Defense Against Climate Change Plan. Watearth evaluated green solutions and vegetation management strategies climate-related vulnerabilities. This plan helped addressed flooding and steep slope challenges, while also mapping out how to mitigate impacts from climate change, periods of drought, and high precipitation.

Contact Watearth for your sustainability and green infrastructure project needs.

The Importance of Water Quality

Water is a precious resource and a fundamental human need, yet it is often taken for granted although extraordinarily little of it is clean and safe enough for use. Over 7 billion people need drinking water, and industry, agriculture, and ecosystems need clean, safe water as well. Water can come from surface water (lakes, rivers, reservoirs) or groundwater such as aquifers which means water quality directly impacts water supply. Sewage, manufacturing processes, and industrial uses can contaminate water. Chemicals such as landscaping fertilizers, pesticides, and other chemicals used in manufacturing or industry can also affect water quality. Other water contaminants can come from livestock and dog parks. Manufacturing can introduce heavy metals such as cyanide and lead (CDC). Additionally, heavy sediment loads from unstable sites and construction sites without proper sediment controls can diminish water quality. Trash also affects water quality, particularly as it breaks down.

Water quality is established by using the physical, chemical, and biological characteristics of water to determine its suitability for a particular use (USGS). According to the United States Geological Survey (USGS) the “dissolved solids concentration in water is the sum of all the substances, organic and inorganic, dissolved in water” and is referred to as “total dissolved solids or TDS.” Common dissolved solids include calcium, magnesium, sodium, potassium, bicarbonate, sulfate, chloride, nitrate, and silica (USGS). The concentration of dissolved solids affects water quality and can make water unsuitable for some uses.

Total maximum daily loads (TMDLs) are also used to determine and improve water quality. According to the EPA, a TMDL is the “calculation of the maximum amount of a pollutant allowed to enter a waterbody so that the waterbody will meet and continue to meet water quality standards for that particular pollutant” (EPA). TMDLs can be used to determine how much of a particular pollutant needs to be removed from a body of water to improve the quality. States use TMDLs to ensure the appropriate action is taken to improve impaired waters. A TMDL is used to “determine the loading capacity of the waterbody and to allocate that load among different pollutants sources so that the appropriate control actions can be taken and water quality standards achieved” (EPA).

Image via Pexels

Water Use

Drinking Water

Water for human consumption must be treated to remove waterborne contaminants that cause sickness and diseases such as E. coli, Hepatitis A, and Giardia intestinalis. Other contaminants like disinfection by-products such as inorganic chemicals, organic chemicals, and radionuclides must also be removed to make water safe for drinking (CDC).

Industry & Agriculture

Water is used in industry for fabrication, processing, washing, dilution, cooling, and transportation of products. It is often also used for sanitation within the facility and is sometimes incorporated into a product. Industries that consume the most water are paper, chemical, food, and oil refinement industries (USGS). Water quality affects the quality of the products produced by industries and water with impurities can make processes such as cooling less efficient.

Water is used in agriculture for irrigation, fertilizer and pesticide application, frost control, crop cooling, and sustaining livestock (CDC). Irrigation requires clean water to avoid contamination of food products and prevent illness. Elevated levels of dissolved solids in water used for irrigation can reduce crop yields because plants cannot easily absorb water from the soil. Additionally, over time the dissolved solids can build up in soils and make the land ill-suited to grow crops (USGS). Water for livestock must also be contaminant-free to prevent illness, low-quality water can reduce livestock productivity.

Ecosystems

Fresh surface waters such as lakes, ponds, rivers, and streams are an integral part of ecosystems, yet they hold less than 0.001% of the planet’s water (EPA). All animals need water to survive, and contaminated water affects both plants and animals. Heavy metals in water can be toxic to animals and cause birth defects and cancer. Water contaminates can also cause disease in illness in animals. Poor water quality also negatively impacts plants. It can limit plant growth and contaminants absorbed by the plants can be passed on to the animals that consume them (CDC).

Image via Pexels

Green and Grey Infrastructure

Water capture and filtration is becoming more important and has started to play a larger role in water quality. In fact, stormwater runoff is one of the top causes of water pollution (EPA). In gray stormwater infrastructure, water flows over impermeable surfaces such as paved roads and parking lots where it can collect pollutants. Untreated water then flows out of urban environments via curbs, gutters, drains, pipes, and collection systems and into bodies of water (EPA). Conversely in green stormwater infrastructure water is absorbed into the earth instead of running into natural bodies of water. Green stormwater infrastructure uses natural processes to improve water quality by allowing rainwater to be absorbed into the ground rather than allowing it to run off impermeable surfaces where it can collect pollutants. Green stormwater infrastructure can also limit flooding by reducing the amount of stormwater and can also improve the aesthetics of an area.

Green infrastructure can be added to existing gray infrastructure by replacing pavement with permeable pavement, expanding green spaces, and adding bioswales and rain gardens. Permeable pavement can be used in parking lots, sidewalks, alleys, and other areas with lower traffic volumes to reduce impervious paved areas which cause runoff and increase water absorption. Green spaces can be added by planting trees between sidewalks and curbs or adding tree boxes in roundabouts to aid in water absorption and natural filtration. Rain gardens and bioretention can be a minimal maintenance addition to an urban landscape that helps improve the aesthetics of an area while also reducing stormwater runoff. Native plants are used in bioswales and rain gardens to reduce irrigation needs and lessen water use they can also create habitats for local wildlife improving the aesthetics of an area. With the addition of green infrastructure elements, water can be redirected from storm sewers to the bioretention areas where water is absorbed and filtered.

Green Roof and Bioswale at Lake Merritt

Water capture and filtration are an important part of water quality. A singular technological solution cannot solve all water supply and water quality challenges. The best overall option is to reduce our impact on the environment at a societal level while also incorporating Green Infrastructure (GI) into more projects. GI (distributed and centralized BMPs) and stream restoration can improve water quality; however, water treatment and the treatment of wastewater still play an important secondary and tertiary role in improving water quality. Additionally, groundwater may require clean-up or treatment before infiltration occurs. Watearth believes in resilient and sustainable water sources to ensure we have safe, clean water sources for years to come.

Watearth is focused on improving water quality through stormwater management, green infrastructure, and drainage planning at the site filtration and regional level. As a water quality-focused firm, we also want to develop public awareness about water quality.

Recently the Watearth team worked with Plummer on the Port of Corpus Christi Authority Drainage Master Plan which included developing a Storm Water Master Plan for the Inner Harbor and Rincon areas. We implemented GI for the new stormwater Best Management and developed GI solutions that work in conjunction with grey infrastructure. We also managed the stormwater volume and the quality of receiving waters under various growth and development scenarios. Watearth worked with the San Franciso Estuary Institute (SFEI) and the California State Water Resource Control Board (CSWRCB) on the Bay Area Regional Green Plan-It Master Plan (Prop 84 Grant). Watearth developed a GI Master Plan and performed watershed-wide GI and water quality modeling.

To read more about Watearth’s projects, visit our Projects Page. If you need assistance with a water quality or environmental project, please contact Watearth.

Watearth Staff Visually Observe Water Quality and Inspect for Trash at Low Water Stream Crossing

What’s going on at Watearth?

Watearth takes on numerous interesting and exciting projects. Take a look at what some of our teammates have to say about their work.

Sinem Gokgoz Kilic, PhD, Environmental Engineer

I am currently working on a reservoir expansion project. For this assignment, I have applied the EPA BASINS (Better Assessment Science Integrating Point and Non-Point Sources) model to a watershed in Texas to examine the hydromodification impacts of the construction of a proposed reservoir on the nearby creek. I modeled sediment transport and water temperature in the creek for both existing and proposed conditions based on the possible discharges from the proposed reservoir during a prolonged drought. TCEQ requires that a reservoir can supply water for 180 days during drought. Using a 180-day continuous simulation using the EPA BASINS model together with HSPF (Hydrologic Simulation Program Fortran), our team analyzed the impact of the proposed reservoir on the creek. We determined that there would be erosion in the creek due to increased discharges from the reservoir. This would lead to increased sedimentation concentration in the creek, as well as a decrease in temperature.

This was very exciting to work on. I not only learned about the application of the modified pulse routing approach using both HEC-RAS and HEC-HMS models concurrently (as two rivers are interacting on a flat floodplain), but I also was able to apply my water quality modeling background. Overall, it was a very interesting and challenging project to work on, and I am very happy to have been a part of it.

Dr. Kilic is a talented environmental and water resources engineer with nearly three decades of experience. Dr. Kilic is experienced in flood inundation mapping through dam breach modeling and Emergency Action Plans for hydropower plants.

Reservoir – BASINS model

Sanja Martic, LA., CEP, Environmental Designer

I am currently working on a water conservation garden turf reduction project in New Jersey. The main goal of the project is to demonstrate an opportunity for water conservation that can be replicated and adopted by home and business owners in the local community. Our client wants to replace the existing, obsolete office building landscape with a landscape that demonstrates low water use. This intervention has opened possibilities to facilitate placemaking, community building, and public outreach, and to restore wildlife habitat and contribute to local biodiversity.

The anticipated landscape design interventions for this project are typically associated with low water use design, and they include shading, amending soil to increase its moisture-holding capacity, and mulching to lower evaporation. Furthermore, the rain garden, which functions as a water storage and infiltration feature, will be planted with ecoregion-appropriate plants. Currently, I am including low water use native plants throughout the garden planting plan. Finally, impervious surfaces are being minimized, and, where and when necessary, low volume drip irrigation will apply water directly to the roots of the plants, minimizing water loss.

We are also developing a brochure and interpretive signage for several areas of the garden.

As a member of the design team at Watearth, I have an opportunity to work nationally on many projects diverse in scale and scope. Some of my favorite assignments allow me to focus on the plant world. I am currently assisting our lead landscape architect, Kathleen Burson, in putting together a plant list for a unique garden on the East Coast.

Sanja Martic is a highly motivated designer and planner who brings decades of experience to the Watearth team.

Adam Susskind, Marketing Communications Manager

I am enjoying working with Los Angeles County Public Works to determine the best path forward on multiple regional surface water projects in various phases of development. We are working collaboratively to identify project challenges and are developing scope adjustments that best serve the project needs. The County is comprised of a group of extremely dedicated and insightful professionals, and this makes putting our heads together a joy. I’ve found the County’s project managers are very willing to identify themselves and the consulting firms as members of the same team, which makes project speedbumps an opportunity to work together towards a common goal, rather than an issue of protecting the interests of different parties. We’re catching details and working them into project management plans to deliver the most successful deliverable possible within the given constraints.

LA County is the most populous county in the United States, which means the efforts I am making in tandem with our senior technical leaders and with the County to produce a cogent scope and budget will lead to a positive outcome for a maximum number of people. This is just another reason why Watearth is a great place to work!

Adam Susskind is a communications specialist for engineering and environmental projects with a decade of combined experience in the technology service, B2B, and A/E/C industries. Susskind is a highly practiced technical writer and editor who approaches all projects with a keen eye for the written word.

Well drilling – Los Angeles, CA

To read more about our work, visit our projects page. Contact Watearth with your project needs.

Field Based Hydraulic Conductivity Testing and its relationship to Stormwater LID features

Here at Watearth, we take pride in performing several field-based Hydraulic Conductivity Tests to determine design infiltration rates of various soil types for the construction of Low Impact Development (LID) design, including Green Infrastructure (GI).

Field testing is crucial for baseline field parameters, including soil parameters, and establishes a framework for the development of LID. In addition to soil group type, texture, and depth, field testing can be used to ground truth desktop research and confirm actual field conditions, such as conductivity rate and design infiltration rate. The design infiltration rate is ultimately used for portions of geotechnical engineering design.

Watearth’s Adam Susskind – DRI Test in Los Angeles

What is Hydraulic Conductivity and Design Infiltration Rate?

Hydraulic conductivity is defined as the ability of soil to transmit water over a given period. Sometimes the hydraulic conductivity is referred to as the “water infiltration rate” when tested over extended periods of time. The hydraulic conductivity of soil is defined by the ability of the soil to infiltrate water under saturated or nearly saturated conditions over time. The infiltration rate can be provided in various units but is typically provided in inches/hour (in/hr).

Hydraulic conductivity can be affected by a multitude of factors. In soils, texture, particle size, distribution, roughness, shape, and structure each affect the overall hydraulic conductivity, or infiltration rate, of a soil. Soil classifications are often helpful descriptors when discussing hydraulic conductivity and include Hydrologic Soil Groups (A, B, C, and D) and the 12 soil textures (sand, loamy sand, sandy loam, loam, silt loam, silt, sandy clay loam, clay loam, silty clay loam, sandy clay, silty clay, and clay).

The Design Infiltration Rate is ultimately the rate that is used for engineering design and the development of LID. The design infiltration rate is a combination of the equalized infiltrations rates determined by testing, and an incorporated Reduction Factor (RF). RF is determined by weighted criteria and is calculated to afford the design an appropriate margin for error and margin for change of conditions over time; this combination provides a value that represents the long-term performance of the proposed design and construction.

Image via Pexels

Examples of Field Tests

At Watearth, after years of experience performing field tests for hydraulic conductivity, there are two tests in particular that we have found to be not only efficient but extremely accurate.  

The first test is the Double-Ring Infiltrometer (DRI). Following ASTM D3385 – 18, the tests require driving two rings into the ground where they are filled with water. The outer ring is driven into the ground further than the inner ring, so the inner ring represents only the downward movement of water.

Two Mariotte Tubes, one with 10,000 milliliters (mL) of capacity to fill the outer ring and one with 3,000 mL volumetric capacity to fill the inner ring, are used to fill the rings and maintain a constant head pressure throughout the testing period. The volume of water infiltrated into the rings is then converted to an infiltration rate, using the ASTM calculation methods.

Constant head pressure is a constant reading created by the pressure of water in the graduated column. It can be further described by the Mariotte Tube Principal: “a Mariotte siphon is based on the principle of a Mariotte bottle, which discharges liquid at constant pressure. Moreover, the difference in height between the bottom of the air tube and exit hole of the siphon maintains a constant head in the inner infiltrometer ring” (Bouwer et al.).

Second, Constant Head Permeameter (CHP) testing utilizes a Guelph Permeameter (GP) to obtain infiltration rates for soils. The GP uses the Mariotte tube principle maintaining a constant head within a borehole, as opposed to the falling head test, which is similar in that soils are tested once saturated, but differs in that the head pressure (the volume of water present at the top) is not required to be maintained . This device consists of a tripod assembly; a support tube and lower air tube fittings; a water reservoir and fittings; and well hydraulic head scale and upper air tube fittings. The GP maintains a constant head as water infiltrates into the soil within the borehole. This rate of infiltration is documented and calculated by the water reservoir volume (Δh) against time (Δt).

Both testing options can be used separately or in combination based upon field scenarios, accessibility, or accuracy techniques.

Watearth’s Jeremy Liby – CHP Testing in Texas

What is LID?

Low Impact Development (LID) refers to systems and practices that use or mimic natural processes that result in the infiltration, evapotranspiration, or use of stormwater to protect water quality and associated aquatic habitat (EPA, 2021).

At Watearth, we utilize field-based hydraulic conductivity testing to determine the design infiltration rate to design and construct different types of LID to promote preferred hydrologic, water quality, and habitat conditions locally and regionally. Watearth deals in many of the popular LID alternatives: rain gardens, bioretention, biofiltration, permeable pavement, vegetated swales, bioswales, green roofs, trees, vegetation, infiltration basins, green streets, blue roofs, subsurface detention, rain barrels, and cisterns.

Watearth’s work

Watearth takes on numerous jobs that involve DRI and CHP testing for LID design.

We worked with Los Angeles County Public Works (LACPW) on their Adventure Park Regional Stormwater Capture and Integrated Water Resources project. Along with work involving civil design, site assessments, and groundwater monitoring on this project, we created an Operations & Maintenance Plan for Low Impact Development and completed a bioretention LID design featuring native and low water use plans. These designs incorporated DRI.

We have additional work incorporating DRI and CHP testing for LID design for private oil and gas clients and work in a public park.  

Contact Watearth today with your project needs.  

Stream restoration: Improving environmental health

What is stream restoration?

The United States Department of Agriculture National Resources Conservation and Service defines stream restoration as, “the reestablishment of the structure and function of ecosystems. Ecological restoration is the process of returning an ecosystem as closely as possible to predisturbance conditions and functions.” The restoration process “reestablishes the general structure; function; and dynamic, but self-sustaining, behavior of the ecosystem.”

Stream restoration improves the biodiversity, flood management, and landscape of the local and downstream ecosystems.

Image via Pexels

Why is it important to restore streams?

The United States Environmental Protection Agency lists numerous benefits to restoring streams.

One important aspect of stream restoration is its ability to preserve and protect aquatic resources. The EPA writes, “existing, relatively intact ecosystems are the keystone for conserving biodiversity, and provide the biota and other natural materials needed for the recovery of impaired systems.”

This is not to say that stream restoration gets rid of the need to protect water resources, rather, it is an additional step that environmental scientists and engineers factor in with other acts of protection and preservation.

Image via Pexels

As humans build, construct, and shift ecosystems, the Earth suffers the consequences. Animal and aquatic species are affected; in this instance, streams, rivers, and wetlands lose a lot of their function. When governments recognize this and take on projects to restore these areas, we can help reconstruct the function of these important aquatic resources.

Regarding restoring natural structure, the EPA writes, “Many aquatic resources in need of restoration have problems that originated with alteration of channel form or other physical characteristics, which in turn may have led to habitat degradation, changes in flow regimes and siltation. Stream channelization, ditching in wetlands, disconnection from adjacent ecosystems and shoreline modifications are examples of structural alterations that may need to be addressed in a restoration project.”

While we cannot restore most streams to their precise original form, we can approximate the sites original physical attributes, resulting in improved water quality and habitat conditions.

Natural stream ecosystems are one tool (like green infrastructure) – that provide tremendous water quality and ecological benefits without the need for other forms of mechanized or chemical treatment that have their own set of auxiliary negative environmental impacts, like consuming energy and material resources.

Stream restoration techniques

Stream restoration is not a one-size-fits-all approach to ecological redevelopment. The Montgomery County, Maryland Department of Environmental Protection highlights some of these techniques:

  1. Brush layering: Placing layers of branches along the stream encourages new plants to grow from the branches and prevents erosion.
  2. Grading/Planting: If a bank of a stream is steep, it can be graded into sloping steps, facilitating stream flow during heavy rainfall. Planting creates roots which hold banks in place.
  3. Log vane: Logs are placed in the stream as a means of diversion away from eroding banks. Additionally, this creates small pools below the vane where various aquatic creatures can live.

Watearth’s work

Watearth has worked on several projects for the City of Austin restoring streams. For the City of Austin Thompkins Tributary Stormwater Control Measures Stream Restoration project, we performed a desktop evaluation of flood plains, soils, range of infiltration rates, topography, land use, aerial photographs, critical environmental features, utilities, and impervious cover within the watershed. Additionally, we performed site reconnaissance to evaluate hydrologic and hydraulic features of sites and vicinities at four locations. We developed six sustainable stormwater control measures at four locations determined by City staff, including an elementary school, vacant lot, an existing flood control wet pond, and a tributary (in conjunction with proposed stream restoration measures).

Watearth additionally worked on the City of Austin Walnut Creek Wells Branch Willow Bend Stream Restoration project. We developed three sustainable stormwater control measures at 10% design. Watearth developed 10% planning-level design alternatives in GIS and evaluated alternatives for water quality performance, multi-use features, flood control benefit, construction cost, O&M cost, life-cycle cost, available right-of-way, utility conflicts, and other criteria used by the City for project development.

Contact Watearth today for all your stream restoration project needs.

Watearth: Everything flows in the right direction

Watearth is happy to share our debut animated explainer video with you. This video highlights our capabilities and our mission to deliver practical and grounded solutions for green infrastructure, water, and environmental projects in service of the triple bottom line. Contact us today with your project needs.

Video transcript:

At Watearth, we understand grey and green infrastructure, water, and the environment. From field work and data collection to planning, modeling, design, and construction. Watearth is a specialized firm and will ensure your project is streamlined from start to on-time finish. Watearth will bring technical expertise to policy development and regulatory understanding to design. We turn your project challenges into opportunities for multi-functional, resilient, and sustainable solutions. Watearth is mindful of client and stakeholder needs; and considers communities down stream of both project sites and planning documents. And we package solutions for practical use, financial, social, and ecological. At Watearth, everything flows in the right direction. Connect with us today to discuss your project needs.

California: A history of drought and fire

What conditions determine a drought?

A drought is defined as “a period of time when an area or region experiences below-normal precipitation.” A lack of rain and snowfall can have a great impact on agriculture, business, and ecosystems. This leads to water shortages, loss of crops, and reduces volumes in water bodies. Droughts are very expensive; the second most costly natural disaster behind hurricanes.

It is often difficult for weather and climate scientists to pinpoint an exact beginning and end to a drought, as meteorological conditions can change suddenly. Droughts can last anywhere from weeks to months to years.

Image via Pexels

California’s history with droughts

The state of California has experienced many droughts in recorded history. There was a five-year event between 2012-2016, with other large-scale droughts during the 2007-2009, 1987-1992, and 1976-1977 periods. In a technical paper published to ASCE Library, California’s drought from 2012-2016 was “one of its deepest, longest, and warmest historical droughts.”

The 1976-1977 drought affected the agricultural industry the most, with an estimated $500 million in losses to the farm industry – particularly related to livestock – in 1976 alone. Adjusted for inflation, that would be over $2 billion in 2021.

The drought in California between 2007 and 2009 also hit agriculture particularly hard – almond, tomato, and lettuce crops were affected the most – resulting in reduced production. California’s hydroelectricity production usually accounts for 15% of all the state’s electricity. In these years it fell to as low as 8% due to lack of water to produce the electricity.

From 2012 through 2016, California’s drought led to water shortages at hydroelectric power plants, reservoirs, aquatic ecosystems, and in the agriculture industry. This drought killed 102 million forest trees and pushed aquatic species such as Chinook salmon close to extinction, in addition to costing billions of dollars in lost income.

How droughts and wildfires intersect

Wildfires are a direct result of droughts. Droughts are a result of dry climates – leading to a lack of moisture in soil. Wildfires can be ignited when lightning strikes dry ground or as a result of damaged utility lines, industrial accidents, and human error (or intent).

Where is California today?

California is amid another drastic drought. The state’s 1,500 reservoirs are presently 50% lower than they should be this time of the year. For example, California’s largest reservoir located in Shasta is only a quarter full.

Image via Pexels

As of right now, all of California is in a drought – no area is untouched. Northern California’s Lake Oroville is a reservoir that serves as a hydroelectric power plant and will likely shut down for the first time since it originally opened in the 1960s.

While this is all happening, California is battling numerous forest fires across the state. In El Dorado County, the Caldor Fire looms close to the resort city of Lake Tahoe, scorching 217,946 acres, destroying 778 houses, and is 53% contained.

Further north, the Dixie fire reached 900,000 acres and is soon to become the largest fire in state history. The largest fire by acreage is the August Complex which burned over 1 million acres last year.

Massive fires are becoming more common at an alarming rate. According to the Mercury News, “Of the top 20 largest wildfires since 1932, 17 have occurred since 2000; 11 since 2016; five in 2020 — and three from this year.”

Image via Pexels

Long range weather forecasts are difficult to produce accurately, though many are hopeful and predict that the fall and winter months – particularly October and November – will bring rain to Northern California. The Peninsula, East Bay, and North Bay have above-normal significant fire potential, and are in need of some rainfall.

Watearth’s Work

Watearth takes pride in our work in water supply and water conservation. On the California central coast, we worked with Cal Poly San Luis Obispo on their Water Resources Master Plan: Technical Studies for EIR, Water Supply Assessment, Wastewater Feasibility, and Reclaimed Water Facility Impacts Evaluation project. For this project Watearth prepared an SB 610 Water Supply Assessment (WSA) for a multi-use development as part of preparation for the EIR. We also performed water supply analysis, demand analysis with water use, and water supply mitigation and performed water distribution system modeling, validating with metered data and incorporating conservation BMPs, including irrigation, fixtures, low water use vegetation, and alternative supply sources, including recycled water, groundwater, and purchased sources.

In Texas, Watearth worked with the Texas Water Development Board on their Statewide Water Conservation BMPs Modeling Tool. This Texas Water Development Board project utilized water demands, user classes and projected demands to create a water conservation BMP model for indoor and outdoor use. BMPs included utilizing recycled water for indoor and outdoor water use. Life-cycles, annual participation rates, incentive program costs and potential cost-benefit to public agencies were analyzed. Climate adaption and resiliency strategies were incorporated into the model.

Additionally, throughout the state of California, Watearth has worked on several solar projects, moving sustainable energy forward.

More broadly, our green infrastructure projects nationwide look at water supply and water quality, with the ultimate aim of infiltrating available stormwater runoff back into local soils.

Ida: The Cost of Hurricanes

Hurricane Ida made landfall on the 16-year anniversary of Hurricane Katrina, both storms similar in their seasonal timing and in the threat they posed.

Katrina’s impact spawned discussions ranging from federal government response to development of additional flood prevention infrastructure such as levees.

Part of Katrina’s massive devastation was due to the failure of the levees. In New Orleans particularly, the extreme amount of water overwhelmed drainage canals and the existing levees, resulting in 80% of the city experiencing flooding.

With the news that Hurricane Ida would hit Louisiana, many worried we would again witness great ravages.  However, NPR has reported that, “the levees, floodwalls and floodgates that protect New Orleans held up against Hurricane Ida’s fury, passing their toughest test since the federal government spent billions of dollars to upgrade a system that catastrophically failed when Hurricane Katrina struck 16 years ago.”

Image via Unsplash

Specifically, the federal government spent $14.5 billion on flooding and storm surge protection in the wake of Katrina. In an interview with Municipal Water Leader, Colonel Michael Clancy (who served as District Commander for the New Orleans District from June 2016 to June 2019) discussed the renovations and new protections that were made post-Katrina. One of their greatest construction efforts was a 130-mile wall of levees and concrete flood walls that surrounded the five parishes of New Orleans.

While the urban areas of New Orleans are presently in better shape than they were after Katrina, the suburbs are more effected. In Jefferson Parish, LA, there was unprecedented flooding as a levee failed leaving “more than 200 people in imminent danger.”

In the Town of Alliance, a floodgate failed and all residents were urged to evacuate immediately.

As of today, over 1 million Louisiana residents and businesses are still without power, nine people have been declared dead as a result of Hurricane Ida in the state of Louisiana and many houses are underwater. Some estimate the total damage cost of Ida in Louisiana will reach $80 billion.

This is a marked improvement over Katrina’s 1,800 fatalities and $164 billion in economic loses, and demonstrates the value of investment in flood control infrastructure.

Ida’s devastation progressed into the week, storming through the Northeastern United States with heavy rainfall and flooding. The death toll on the East Coast currently lies at 46.

As climate change becomes a growing issue, it is important that the federal government consider investing more in flood prevention infrastructure.

Image via Unsplash

Natural disasters like Katrina and Ida cost billions. Hurricane Sandy, which hit New Jersey, Connecticut and New York in 2012, left behind $63 billion in damages.

One study, published in Nature vol. 12, attributed $8 billion of damage from Hurricane Sandy to rising sea levels caused by climate change. The study postulates that an additional 70,000 people were affected by Hurricane Sandy due to climate change than would have been otherwise.

As hurricane-related flooding becomes more frequent, flood prevention infrastructure becomes a more important investment. While levees are the primary form of flood prevention infrastructure in New Orleans, other cities call for other measures.

Green infrastructure (i.e. rain gardens) is demonstrably effective at managing flood risk. It reduces runoff volumes considerably and approaches the problem from the perspective of infiltration rather than routing.

Watearth’s work on managing flood risk dates back to 2008 and has recently included work for the City of Austin on their drainage criteria manual. This manual plays a crucial role in protecting and restoring the health of the city’s watersheds. It also evaluated stormwater runoff and rainfall events – all key to helping to mitigate flooding. Watearth has written and updated more than a dozen such criteria manuals and master plans and considers it the foundation for informed design in complex urban environments.


FEMA and Flood Plain Mapping: What you need to know

What is FEMA?

FEMA stands for the Federal Emergency Management Agency and was established via Executive Orders 12127 and 12148 signed by then-President Jimmy Carter. Carter gave FEMA the “dual mission of emergency management and civil defense.”

Today, FEMA’s mission is defined as, “helping people before, during and after disasters, and our guiding principles help us achieve it.” FEMA supplies numerous services from disaster unemployment assistance to risk management information and grants.

Flood Maps

One key service FEMA provides is flood maps. Floods are meteorologically unpredictable and are increasingly a result of climate change. Most recently, areas of western Europe have been hit with massive flooding, completely washing away roads and homes. Germany and parts of Belgium were hit the hardest, with a confirmed death toll above 160 people. In the United States, Tennessee suffered a flash flood as a result of 17 inches of rain falling in a 24 hour period. At this point in time, the death toll lies at 20. 270 homes were destroyed and another 160 experienced significant damage.

These heavy and sudden rainfalls are attributed to climate change and are likely to become more common as average global temperatures rise annually. As the atmosphere warms, it holds and precipitates more water. Additionally, in areas that experience regular snowfall, the snow melts faster and earlier, leading to spring flooding. There has also been an increasing frequency of hurricanes and sea levels are rising, all factors contributing to an increase in flooding.

FEMA provides flood maps online via their FEMA Flood Map Service Center (MSC). These maps aim to help communities understand the flood risk in their areas, and can help guide decisions regarding reducing or managing flood risk.

Flood maps work by indicating the flood risk within a zip code area in the United States. These maps are very localized, and can even indicate where the level of an individual stream is likely to rise. FEMA designates any area that has a 1% chance or higher of experience a flood each year as a high-risk location. The 1% annual exceedance probability (AEP) is the basis of the National Flood Insurance Program. A 1% AEP flood has a 1 in 100 chance of being equaled or exceeded within a year, it has a recurrence interval of approximately 100 years – meaning it is a “100-year flood.”

FEMA also allows revisions to the flood maps. These include Conditional Letter of Map Revision (CLOMR), Letter of Map Revision (LOMR), and Letter of Map Amendment (LOMA). A CLOMR does not revise a National Flood Insurance Program (NFIP) map, it indicates whether a proposed project (i.e. modifying a floodway) would be recognized by FEMA. A LOMR is FEMA’s modification to an effective map. These are based on physical measures implemented in an area that would affect the hydrologic/hydraulic characteristics of a flood source. A LOMA is an official amendment to a NFIP map.


Image via Unsplash

Watearth’s Work With Floods

Here at Watearth, we understand the importance of floodplain mapping and other preventative measures. We take on numerous projects to help with drainage master plans and flood plain management.

Our CEO, Jennifer J. Walker, P.E., D.WRE, CFM, ENV SP, QSD, worked with the City of Houston Regional Detention Stormwater Master Plan (Including Water Quality Analysis). This high-profile project, initiated by the Mayor, identified, analyzed, and selected regional detention sites to mitigate City Capital Improvements Plan (CIP) projects and reduce flooding. During the project, Watearth also performed watershed and impacts analysis in HEC-HMS, performed a cost-benefit analysis, and targeted TSS and bacteria for impaired watersheds. Additional project components included evaluating, analyzing, and recommending stormwater quality Best Management Practices (BMPs) for CIP roadway, LID, and drainage projects. Watearth also included recommendations for stormwater quality BMPs associated with regional detention facilities and drainage features within park land for educational purposes.

Additionally, Watearth collaborated with the City of Austin on their Stormwater Drainage Criteria Manual (DCM). Watearth worked on the forward-thinking drainage criteria manual that played a crucial role in protecting and restoring the health of the City’s watersheds and also protects the City’s investment in stream restoration and natural channel design projects. Updates to the DCM were incorporated into City code following City protocols and code update processes. Watearth performed a literature review and data evaluation related to methods used nationwide to address excess urban runoff volume and provided recommendations for stormwater control/management strategies to achieve volumetric detention goals for the City of Austin. The project recommendations complied with federal, state, and local regulations for stormwater quality. We developed Volumetric Design Procedure criteria and recommended incorporation of Green Infrastructure and Hydromodification Management techniques. Additionally, Watearth developed guidance and criteria for developing stage hydrographs and tailwater criteria for detention routing and performed peer review of natural channel design criteria revisions. Other project elements included performing HEC-HMS modeling (hydrology) and evaluating the effect of rainfall distribution on peak flows and estimated detention volumes for the 25-year and 100-year rainfall events using updated NOAA Atlas 14 rainfall depths.

Watearth also worked on three watershed studies and a prepared Letter of Map Revisions (LOMR) submittals to the Federal Emergency Management Agency (FEMA) to remove filled areas within the regulatory flood plain for three project sites; Cedar Brook Ridge, Creekside Hills, and Heartwood Park (TX). Also in Texas, Watearth has updated FEMA’s floodplain maps and these were integrated into FEMA’s digital geospatial flood inundation mapping tool, which aims to accurately reflect observed and modeled hydrodynamic conditions to improve communication, understanding, and public safety before flood events occur.

If you’d like to learn more about Watearth’s work with hydrology and hydraulics and the services we offer, please visit our website.


Image via Unsplash 

Rain Gardens: Beautiful & Functional

Rain gardens are an excellent combination of beauty and function. They brighten up a space and provide a habitat for local wildlife and insects, while they also filter pollutants out of stormwater, help prevent flooding, and keep our waterways clean.

What Rain Gardens Do

Rain gardens are recessed areas in landscape planted native flowers and shrubs that collect water runoff, known as stormwater, and allow it to soak into the ground. Water ponds within the rain garden temporarily before it is filtered into the ground either into the underlying soils or an underdrain. While the water filters through the soil it is also absorbed by the vegetation planted in the garden. Pollutants in the water are removed as they filter through the soil and are absorbed by plants. More complex rain gardens with underdrains and amended soils are called bioretention.

A wide range of vegetation can be used in rain gardens, including grasses, trees, flowering perennials, and shrubs. Depending on the location within the rain garden, plants can have a variety of water needs from water-loving plants in the ponding area of the garden to drought-tolerant plants along the outside edge of the garden.  

Sewage Overflow Warning

The Importance of Managing Stormwater

Stormwater is any precipitation that does not get directly absorbed into the soil and instead flows over the ground. When stormwater is absorbed into the ground, soil and plants can filter out pollutants. However, when stormwater flows over hard or paved surfaces there is nothing to filter out the pollutants in the water. Stormwater can include many pollutants such as fertilizers, pet waste, litter, oil and grease from vehicles, soaps, and other chemicals that have leaked or been spilled on the ground.

Stormwater runoff typically occurred during large storms when the rate of rainfall exceeded the rate at which the ground could absorb the water. However, today with increased development and more paved and impervious surfaces, stormwater runoff has increased. In cases where stormwater is flowing directly into rivers, streams, or other bodies of water, stormwater pollutants also flow into those bodies of water. In many cities stormwater flows into sewer systems where the water then goes to a treatment facility. However, when these sewer systems overflow, the excess untreated water is often discharged directly into local bodies of water, increasing the level of pollutants and sewage in the water. With the increase in impervious surfaces in cities, stormwater can frequently overload the sewer system causing an overflow. By incorporating rain gardens into landscapes, stormwater is better managed and runoff can be avoided. Learn more about stormwater sources and solutions.

Watearth Rain Gardens & Bioretention Projects

Watearth believes bioretention is best when it comes to stormwater and water quality.

Shortly after the Louisville, KY Metropolitan Sewage District rain garden was completed there was a 100-year event that tested its capabilities. Water poured out of the downspout from the roof of the building filling the rain garden. The rain pooled in the garden and was ultimately absorbed and drained out of the rain garden avoiding flooding and an overflow of stormwater. Erosion control measures were put into place to form the downspout into the rain garden and proved very functional during the rain event allowing water to flow directly into the rain garden.

If you would like to learn more about Watearth and our services, please visit our website. We are happy to discuss your stormwater and bioretention project needs.

For more information about Watearth’s work with Rain Gardens and Bioretention, please see the Watearth webinar on Engineering Rain Gardens and Bioretention presented by Watearth President Jennifer J. Walker, P.E., D.WRE, CFM, ENV SP, QSD.